【集群】K8S集群、KubeSphere管理平台搭建记录——故障排除:Node Exporter connection refused

💡简介
在多节点KubeSphere管理的K8S集群上部署监控组件后,通过Prometheus看到NodeExporter出现Get "https://xx.xx.xx.xx:9100/metrics": context deadline exceeded和Get "https://xx.xx.xx.xx:9100/metrics": dial tcp xx.xx.xx.xx:9100: connect: connection refused报错。
本篇博客将先进行信息收集,构建导致报错的因果链,再基于因果链逐步断点排查。
🖼️背景
在四个跨运营商的公有云节点上,通过KubeSphere部署kube-Prometheus相关组件。
🕸️组件信息
组件部署于 kubesphere-monitoring-system namespace,具体信息如下:
1 | $ kubectl get all -n kubesphere-monitoring-system -o wide |
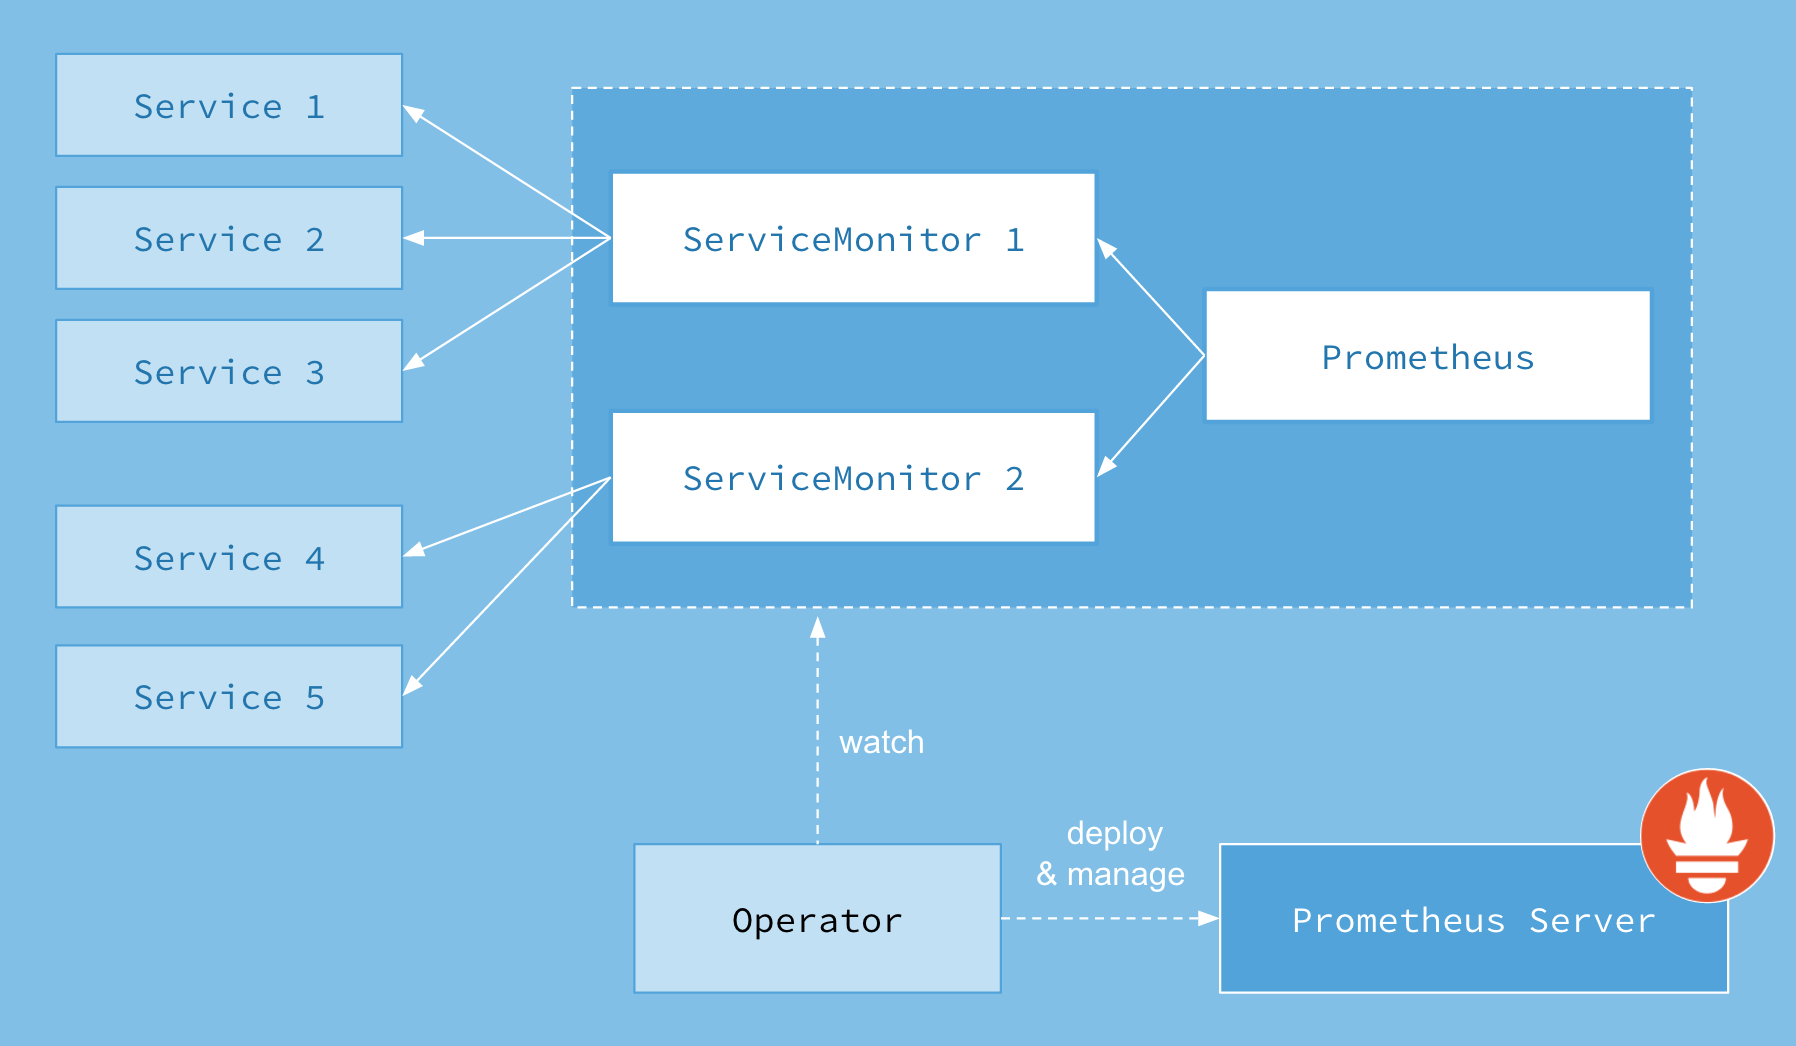
ps:对于Prometheus的target界面各项内容,通过ServiceMonitor资源定义[1]。
ps:prometheus-operator 和直接部署 prometheus 区别是 prometheus-operator 把 prometheus 、 alertmanager server 的配置, 还有 scape config 、 record/alert rule 包装成了 k8s 中的 CRD 。对于Prometheus 的 Configuration 界面各项配置,通过以下CRD定义:
1 | $ kubectl get crd | grep monitoring |
查看Configuration界面,可看到以下配置:
1 | global: |
对于超时问题,可以修改prometheuses.monitoring.coreos.com类型资源的 scrapeTimeout 参数。(本次修改后发现仍然报错)
💥报错信息
Node Exporter 出现 Get "https://xx.xx.xx.xx:9100/metrics": context deadline exceeded (ali-2) 和 Get "https://xx.xx.xx.xx:9100/metrics": dial tcp xx.xx.xx.xx:9100: connect: connection refused (ali-1、huawei-1) 报错。
除 Node Exporter 外,kubelet、kubelet/cadvisor 也有报错:ali-2 节点 Get "https://xx.xx.xx.xx:10250/metrics": context deadline exceeded,Scrape Timeout为10s、1m时都报错。
🔗因果链
自底向上分析:
- 底层4个
节点通过网络连接(可通过 ping 确认正常连通)。 - 4个节点上部署
Node-Exporter Pod,监控指标(可通过访问 Pod 、查看 Pod log 确认正常运行)。 - 4个节点上暴露
Node-Exporter ServiceEndpoint 端口,暴露指标(可通过从每个节点访问本机 Service Endpoint 确认正常运行)。 - 某个节点上 Prometheus 通过 ServiceMonitor 规则监控 Service 的 Endpoint(可通过从 Prometheus 所在节点访问 Service Endpoint 确认正常运行)。
🧠排查思路
1️⃣节点正常连通
步骤:
- 进入Node-Exporter唯一不报错的节点(理论上应该是Prometheus所在节点)。
- Ping其他3个节点。
结果:
均能正常连接。说明节点正常联通。
2️⃣Pod正常运行
步骤:
- 通过
kubectl exec -it -n kubesphere-monitoring-system $(kubectl get pod -n kubesphere-monitoring-system --field-selector spec.nodeName=$NodeName -l app.kubernetes.io/name=node-exporter -o jsonpath='{.items[0].metadata.name}') -c node-exporter -- sh(将$NodeName替换为所需要进入的pod所在节点名)
结果: - 发现
ali-1、huawei-1、huawei-2上的Pod均正常,ali-2上的Pod连接超时:Error from server: error dialing backend: dial tcp xx.xx.xx.xx:10250: i/o timeout
3️⃣Service正常暴露
步骤:
- 依次登录每个节点
- 访问本节点服务
a.curl localhost:9100均正常响应
b.curl ${本机ip}:9100均响应Client sent an HTTP request to an HTTPS server.
c.curl https://${本机ip}:9100均响应curl: (60) Peer's certificate issuer has been marked as not trusted by the user.
d.curl https://${本机ip}:9100 -k均响应Unauthorized,根据[4]了解需要增加认证
e.curl https://${本机ip}:9100/metrics -k --header 'Authorization: Bearer '$(kubectl exec -it -n kubesphere-monitoring-system prometheus-k8s-0 cat /var/run/secrets/kubernetes.io/serviceaccount/token)正常响应
结果: - 每个服务均正常运行(包括上一步出错的
ali-2,所以怀疑是k8s至ali-2的网络配置有问题) - 通过非localhost的访问均失败
4️⃣Service正常访问
同上,访问其他节点ip:9100无效
🛠️解决方法
🔨方法1:暴露接口(不安全)
- 对于
daemonset类型资源node-exporter,配置文件中限制127.0.0.1,即仅通过本机访问时才可成功,因此都修改为0.0.0.0。具体如下:1
2
3
4
5
6
7
8
9
10
11
12
13
14
15
16
17
18
19
20
21
22
23
24
25
26
27
28
29
30
31
32
33
34
35
36
37
38apiVersion: apps/v1
kind: DaemonSet
metadata:
labels:
app.kubernetes.io/component: exporter
app.kubernetes.io/name: node-exporter
app.kubernetes.io/part-of: kube-prometheus
app.kubernetes.io/version: 1.3.1
name: node-exporter
namespace: kubesphere-monitoring-system
spec:
...
template:
...
spec:
...
containers:
- args:
- --web.listen-address=0.0.0.0:9100
# - --web.listen-address=127.0.0.1:9100
...
name: node-exporter
...
- args:
...
- --secure-listen-address=[$(IP)]:9100
- --upstream=http://0.0.0.0:9100/
# - --upstream=http://127.0.0.1:9100/
...
name: kube-rbac-proxy
...
ports:
- containerPort: 9100
hostPort: 9100
name: http # 只是名字,可以不修改。注意要和ServiceMonitor中对应。
# name: https
protocol: TCP
... - 进一步地,存在报错
Get "https://xx.xx.xx.xx:9100/metrics": http: server gave HTTP response to HTTPS client。调整 Prometheus ServiceMonitor 协议由 https 改为 http。1
2
3
4
5
6
7
8
9
10
11
12
13
14
15
16apiVersion: monitoring.coreos.com/v1
kind: ServiceMonitor
metadata:
labels:
app.kubernetes.io/component: exporter
app.kubernetes.io/name: node-exporter
app.kubernetes.io/part-of: kube-prometheus
app.kubernetes.io/vendor: kubesphere
app.kubernetes.io/version: 1.3.1
name: node-exporter
namespace: kubesphere-monitoring-system
spec:
endpoints:
- ...
scheme: http
# scheme: https - 初次设定时,发现 node-exporter Pod 疯狂重启。通过
1
2
3
4
5NAME READY STATUS RESTARTS AGE
node-exporter-4bdcq 1/2 CrashLoopBackOff 508 42h
node-exporter-pxfvd 1/2 CrashLoopBackOff 508 42h
node-exporter-qwb56 1/2 Error 509 42h
node-exporter-tq29h 1/2 CrashLoopBackOff 170 42hkubectl log查看日志,对于node-exporter容器一切正常,对于kube-rbac-proxy容器存在以下报错:但通过1
2
3
4
5
6
7
8
9
10
11
12
13
14
15
16
17
18
19
20
21I0126 02:53:41.152101 7520 main.go:180] Valid token audiences:
I0126 02:53:41.152228 7520 main.go:284] Generating self signed cert as no cert is provided
I0126 02:53:41.493354 7520 main.go:334] Starting TCP socket on [xx.xx.xx.xx]:9100
F0126 02:53:41.493523 7520 main.go:337] failed to listen on secure address: listen tcp xx.xx.xx.xx:9100: bind: address already in use
goroutine 1 [running]:
k8s.io/klog/v2.stacks(0xc00000e001, 0xc0000e61e0, 0x8a, 0x97)
/home/runner/go/pkg/mod/k8s.io/klog/v2@v2.3.0/klog.go:996 +0xb9
k8s.io/klog/v2.(*loggingT).output(0x22af0c0, 0xc000000003, 0x0, 0x0, 0xc000572a10, 0x2207d01, 0x7, 0x151, 0x0)
/home/runner/go/pkg/mod/k8s.io/klog/v2@v2.3.0/klog.go:945 +0x191
k8s.io/klog/v2.(*loggingT).printf(0x22af0c0, 0x3, 0x0, 0x0, 0x1783952, 0x26, 0xc0000dfbe8, 0x1, 0x1)
/home/runner/go/pkg/mod/k8s.io/klog/v2@v2.3.0/klog.go:733 +0x17a
k8s.io/klog/v2.Fatalf(...)
/home/runner/go/pkg/mod/k8s.io/klog/v2@v2.3.0/klog.go:1463
main.main()
/home/runner/work/kube-rbac-proxy/kube-rbac-proxy/main.go:337 +0x2717
goroutine 6 [chan receive]:
k8s.io/klog/v2.(*loggingT).flushDaemon(0x22af0c0)
/home/runner/go/pkg/mod/k8s.io/klog/v2@v2.3.0/klog.go:1131 +0x8b
created by k8s.io/klog/v2.init.0
/home/runner/go/pkg/mod/k8s.io/klog/v2@v2.3.0/klog.go:416 +0xd8lsof和netstat排查,并无其他程序占用该端口。回头一想,应该是node-exporter和kube-rbac-proxy两个容器发生了冲突。
对yaml文件中的关键参数进行解析:
node-exporter容器中的web.listen-address参数:- 作用: 指定Node Exporter监听的网络地址和端口。这是Node Exporter提供监控指标的地址,Prometheus通过这个地址来获取节点的监控数据。
- 例子:
--web.listen-address=127.0.0.1:9100表示Node Exporter会监听本地地址的9100端口。
kube-rbac-proxy容器中的secure-listen-address参数:- 作用: 指定Node Exporter启用安全连接时的监听地址和端口。这通常用于启用HTTPS连接,以确保监控数据的传输安全。
- 例子:
--secure-listen-address=[$(IP)]:9100表示以安全方式监听在指定的IP地址的9100端口。
kube-rbac-proxy容器中的upstream参数:- 作用: 指定一个上游的Node Exporter地址,用于代理请求。这在一些网络配置中可能会用到,例如在使用代理的情况下,将请求代理到指定的Node Exporter地址。
- 例子:
--upstream=http://127.0.0.1:9100/表示将请求代理到本地地址的9100端口。
因此,当 node-exporter 容器中的 --web.listen-address 和 kube-rbac-proxy 容器中的 secure-listen-address 参数一样时,会发生冲突。因此设置为不同的端口分别暴露即可。
ps:至此可以看出,本方法本质上是绕过了 kube-rbac-proxy 容器,直接让 node-exporter 容器暴露端口给Prometheus。因此可能导致不安全的访问(例如数据完全暴露,任何人都可以随意访问)
🔨方法2:调试 kube-rbac-proxy
恢复原始配置后,根据[4]一步步排查:
在 Node-Export yaml 配置文件中看到几个配置[5][6]:
1 | spec: |
- 修改如下:
1
2
3
4
5
6
7spec:
template:
spec:
# dnsPolicy: ClusterFirst
# hostNetwork: true
dnsPolicy: ClusterFirstWithHostNet
hostNetwork: false
发现当 hostNetwork: true 时,curl localhost:9100/metrics 始终无响应。
发现当 dnsPolicy: ClusterFirst 时,curl 其他节点ip:9100/metrics 始终无响应。(但hostNetwork: false时dnsPolicy应当无效才对)
修改为以上配置后,监控恢复正常。(对该部分调整后似乎数据仍然正常,可能其实是修改了其他配置导致的修复,还有待进一步确定)
🔨方法3:检查防火墙
本方法针对 ali-2 节点的 Get "https://xx.xx.xx.xx:9100/metrics": context deadline exceeded 报错。
由于是租用的公有云服务器,因此特意配置了安全组(相当于公有云提供的外部防火墙)开放特定端口,但仍然报错。提交工单咨询售后工程师后,发现服务器内部还有防火墙需要配置。
对接过程中,检查流程如下:(在明确服务本身正常运行,只可能是网络联通问题的前提下)
- 确定出问题的端口号。如本次调试 Node-Exporter 组件,涉及的端口号为
9100。 - 从外部检测端口联通性。
telnet ${ip} ${port}。若不通,首先检查并配置外部防火墙(公有云安全组)。 - 从内部检测端口联通性。进入服务器,执行
telnet 127.0.0.1 ${port}。若不通,检查内部防火墙,手动开放防火墙端口iptables -I INPUT -p tcp --dport 9100 -j ACCEPT(临时开放端口)。 - 检查内部防火墙规则。
1
2
3
$ netstat -ntulp
$ firewall-cmd --list-all
$ iptables -nL - 检查内部防火墙启动情况。
1
2
systemctl status iptables.service
ufw status
排查后,首先确认端口被防火墙拦截。进一步检查防火墙型号,发现没有安装 iptables 防火墙,但是安装了 ufw 防火墙。
因此,开放端口或关闭防火墙即可。
- 开放端口:
ufw allow 9100 - 关闭防火墙:
ufw disable
关闭防火墙后,所有 target 状态变绿(Nice!)。
🏥反思
- 构建因果链排错的效率很高,以后要继续保持。
- 希望这篇博客对你有帮助!如果你有任何问题或需要进一步的帮助,请随时提问。
- 如果你喜欢这篇文章,欢迎动动小手给我一个follow或star。
🗺参考文献
[1] Kubernetes监控方案kube-prometheus(prometheus, node-exporter, grafana)
[2] Prometheus-Operator模式下的Prometheus配置
[4] KubeSphere开发者社区:v3.3.1 所有组件都健康,但是没有任何监控数据
[5] kubernetes hostNetwork: true 网络
[6] Fix Context Deadline Exceeded Error in Prometheus Operator
- 标题: 【集群】K8S集群、KubeSphere管理平台搭建记录——故障排除:Node Exporter connection refused
- 作者: Fre5h1nd
- 创建于 : 2024-01-24 10:38:54
- 更新于 : 2024-03-08 15:36:52
- 链接: https://freshwlnd.github.io/2024/01/24/k8s/k8s-network-node-exporter/
- 版权声明: 本文章采用 CC BY-NC-SA 4.0 进行许可。